Ripple Price Analysis: Calm Before the Storm for XRP After 6.5% Weekly Decline?
Ripple has encountered intense selling pressure near the key resistance zone, defined by the 100 and 200-day moving averages around the $0.55 mark.
This has led to a sharp rejection and subsequent decline. The asset now hovers near a crucial support region, which could trigger a period of sideways consolidation.
XRP Analysis
By Shayan
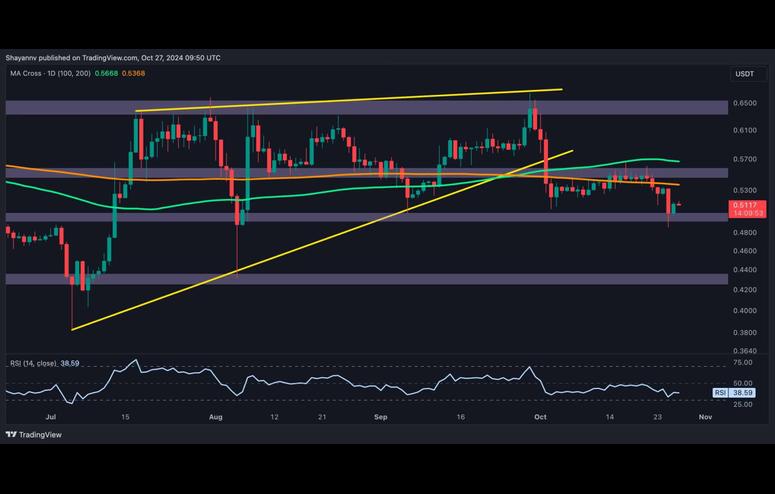
The Daily Chart
On the daily chart, XRP saw a spike in selling activity as it approached the $0.55 resistance level, where the 100-day and 200-day moving averages intersect. This zone represents a significant supply area, and the rejection from this level caused a 14% price drop.
Ripple is now testing the $0.5 support, a level that has acted as a solid base since mid-July. This support region may attract enough buying interest to slow down the bearish momentum, leading to a consolidation phase before the next move.
The 4-Hour Chart
The 4-hour chart reveals a more detailed view of Ripple’s bearish price action, with a series of lower highs and lower lows forming a clear downtrend. The price recently broke below the lower boundary of the bearish flag pattern, confirming a continuation of the downtrend.
Ripple has now entered a significant support zone between the 0.5 ($0.52) and 0.618 ($0.49) Fibonacci retracement levels. If the price manages to break below the 0.618 Fibonacci level, a further decline toward the $0.46 support is possible. However, if the asset finds support in this region, a period of consolidation could ensue in the short term.