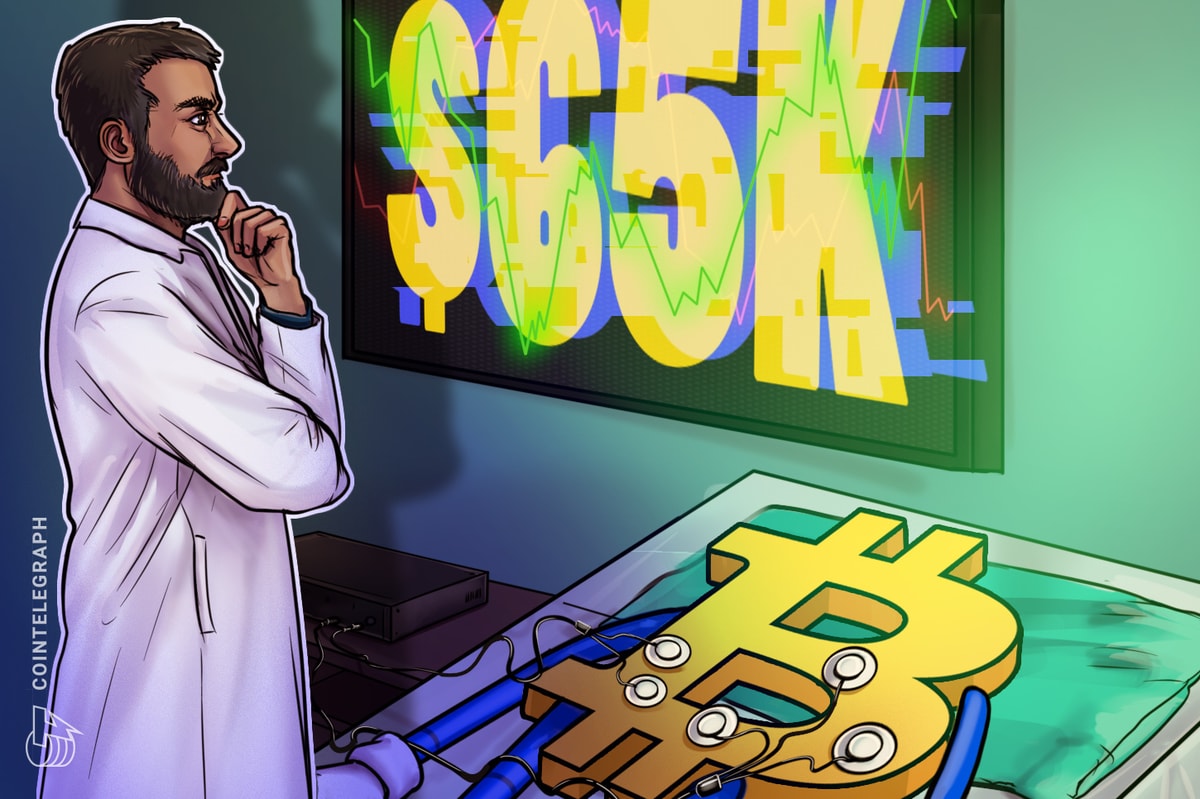
BTC price eyes sub-$65K hurdles as metric hints Bitcoin 'going to rip'
Bitcoin (BTC) climbed to multi-day highs on Oct. 12 as markets mimicked last weekend’s dubious upside.
BTC/USD 1-hour chart. Source: TradingView
BTC price grills resistance below key barrier
Data from Cointelegraph Markets Pro and TradingView showed BTC price action nearing $63,500, up 1.5% on the day — similar behavior to the weekend prior.
BTC/USD made strong progress during the Oct. 11 Wall Street trading session after testing $60,000 support for much of the week.
Attempting to catch up with United States equities, Bitcoin shrugged off new US inflationary pressures, even as markets reduced bets on the extent of future interest rate cuts.
“Initial low was swept & clearly inability to breakdown so naturally there’s a reversion,” popular trader Skew wrote in his latest coverage of 4-hour timeframes on X.
Skew flagged relative strength index (RSI) scores above 50 and spot demand — key prerequisites for a “move up.”
“Monthly & Weekly open are always pretty pivotal so very important for buyers to reclaim for another shot at $65K,” he concluded.
BTC/USDT 4-hour chart. Source: Skew/X
The monthly and weekly open levels correspond to $62,850 and $63,330, respectively, making the current spot price area a key battleground.
Analyzing exchange order book liquidity, trading resource Material Indicators added two more nearby BTC price upside targets just below $65,000.
“FireCharts shows Bitcoin support stacking above $63k, and it looks like bulls want to challenge the 200-Day Moving Average,” it told X followers, referring to one of its proprietary trading indicators.
“If they are successful, clearing the 200-Day MA, they will attempt to R/S flip Technical Resistance at the 2021 Mid-Cycle Top at $64.9k.”
BTC/USDT order book liquidity for Binance. Source: Material Indicators/X
Despite the tenuous reliability of weekend BTC price gains, trader, analyst and entrepreneur Michaël van de Poppe expected the good times to continue for bulls next week.
“Bitcoin took the liquidity beneath $59.5k and quickly ran up,” he summarized.
“Probably few days of consolidation, before next week is going to be significantly up. Breakout of $64k / $65k is the big breakout we're looking for before new ATH tests and Altcoin runs are happening.”
BTC/USDT 6-hour chart. Source: Michaël van de Poppe/X
Stablecoin market cap boosts Bitcoin bull run hopes
An equally optimistic prediction came from Bitcoin analytics account Bitcoindata21, which uploaded a metric seen to be repeating bull market behavior.
Related: BTC price gains 'on horizon' as Bitcoin whales buy 1.5M BTC — Analysis
The overall market cap of major US dollar stablecoins relative to Bitcoin, having spent months in a consolidation phase amid a broad downtrend, looked ripe to continue heading lower, a chart uploaded to X showed.
“Those trend lines are so clean,” part of the accompanying commentary stated.
“Once the purple line breaks to the downside, bitcoin is going to rip. Then wait for the downtrend to reverse (see yellow trend channels)... thats when the top is in!”
Stablecoin vs. Bitcoin market cap. Source: Bitcoindata21/X
This article does not contain investment advice or recommendations. Every investment and trading move involves risk, and readers should conduct their own research when making a decision.