Is Ethereum Going to Finally Explode to $2,000? (ETH Price Analysis)
Ethereum’s price has recently rebounded and is currently testing a key area.
In case the bullish momentum carries on, the price is likely to head toward the $2,000 resistance zone in the near future.
Technical Analysis
By Edris
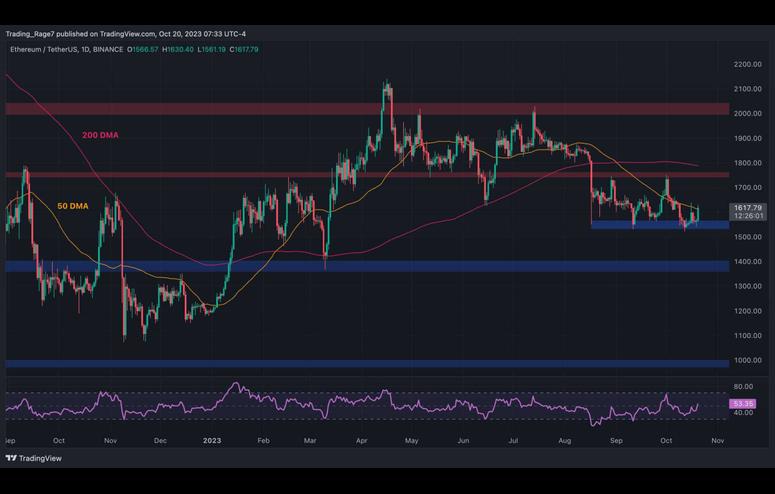
The Daily Chart
On the daily timeframe, the $1,550 support level has once again held the price, preventing it from dropping lower toward the $1,400 area. The 50-day moving average is currently being tested around $1,600.
If ETH breaks above, the $1,750 resistance level and the 200-day moving average located near the $1,800 mark are the next likely targets.
The RSI indicator has also risen above the 50% threshold, pointing to the fact that the momentum is in favor of the buyers once more.
The 4-Hour Chart
Looking at the 4-hour chart, it is evident that the price has been consolidating between the $1,550 and $1,750 levels for the past few months. However, the market has once again rebounded from the $1,550 level recently and is currently testing the $1,600 resistance zone.
A bullish breakout from this area would pave the way for a further rally toward $1,750 in the coming weeks. However, investors should keep an eye on the RSI indicator as it is entering the overbought region again, which could result in a rejection from the $1,600 zone.
On-Chain Analysis
By Edris
Ethereum’s price has recently shown upward momentum following months of consolidation and gradual decline. This PA has left investors wondering whether a new bullish phase is on the horizon or lower prices are still to be expected.
This chart depicts the 100-day moving average of the taker buy-sell ratio metric, one of the most valuable futures market sentiment indicators. Takers are orders executed aggressively at market price and are the ones that move the price. Taker buy-sell ratio values below 1 show bearish sentiment, while values above 1 are considered bullish.
As the chart demonstrates, this metric has risen recently but is still below 1. If this increase in the taker buy-sell ratio continues and the metric climbs above 1, a new price rally could be expected, and the market could finally break above the $2,000 resistance level. However, if the metric fails to break above 1, things are unlikely to change, and the price could drop further in the short term.