Here's the Most Likely Scenario for XRP in the Coming Days (Crash Incoming?): Ripple Price Analysis
The price of Ripple is currently showing concerning signs on both the USDT and BTC paired charts. It might be the case that the value of XRP will decrease in the coming weeks in terms of both the US dollar and Bitcoin, but there might also be more to the story.
Technical Reckoning
By Edris
The USDT Paired Chart
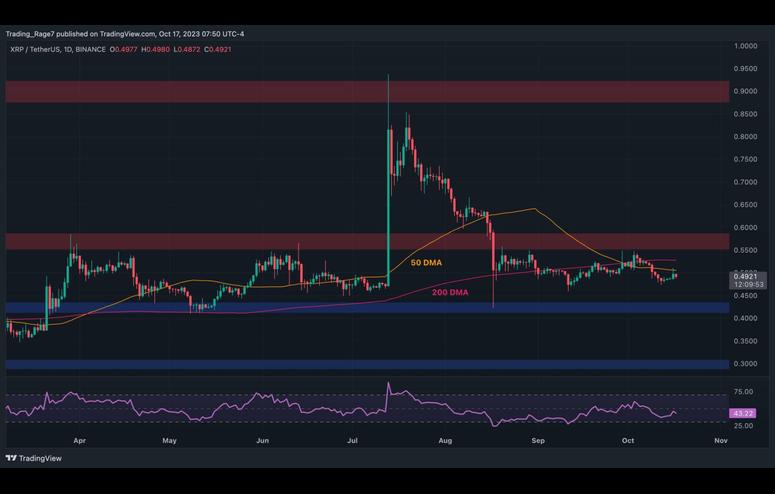
Against USDT, the price has recently been bullish, with several consecutive green daily candles. However, the price was rejected by the 50-day moving average, which is around the $0.5 mark and is currently preventing it from rallying higher.
If the market fails to break above this level, it is likely that the price will drop to $0.43. Conversely, if XRP breaks above the 50-day moving average, it could result in a rally towards the key $0.55 resistance zone and potentially even higher.
The BTC Paired Chart
Against BTC, the chart presents an even worse situation for XRP. The price has recently broken below the 1800 SAT support level and does not seem likely to bounce back soon.
The 50-day and 200-day moving averages are also indicating a bearish crossover near the 1900 SAT level, suggesting the beginning of a potential downtrend. The RSI indicator is also showing values below 50%, indicating that the momentum favors the bears and the price is likely to drop towards the 1600 SAT area in the coming weeks.