Bitcoin May Be Forming a 'Bull Flag' on Price Chart: Technical Analysis
TL;DR Bitcoin's price is currently forming a "bull flag" pattern, which indicates that it is likely to rally further. A breakout from the flag would shift focus to the next resistance at $35,900.
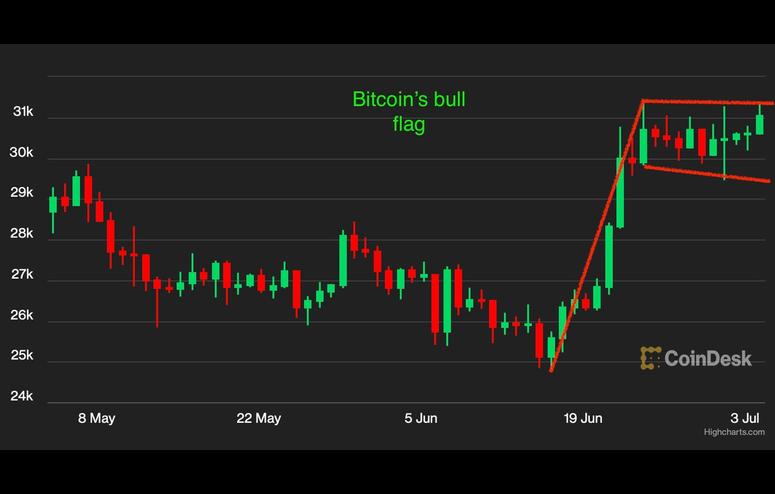
Bitcoin's (BTC) recent price consolidation above $30,000 seems to be taking the shape of a technical analysis pattern called a "bull flag," a pattern that indicates a further rally is likely to be on the cards.
"Bitcoin is digesting its gains in a consolidation phase. A bullish flag may be forming and would be completed on a breakout above the weekly [Ichimoku] cloud near $31,900," analysts at technical analysis research provider Fairlead Strategies wrote in a note to clients on Monday.A bull flag consists of a pole and a flag. The pole represents the initial price rally and the flag represents subsequent consolidation stemming from temporary exhaustion of bullish sentiment and the absence of strong selling pressure.According to technical analysis theory, once an asset has broken through the flag, it tends to rally an amount roughly equal to the length of the pole. A breakout is confirmed once the upper end of the flag is breached.In bitcoin's case, the move higher from the June 15 low of $24,770 to the June 23 high of $31,441 represents the pole, while the subsequent consolidation represents the flag.A potential BTC breakout from the flag would shift focus to the next resistance at $35,900, according to Fairlead.